Dashboard Overview
The ferrite dashboard is a web frontend for visualizing device telemetry collected by the ferrite-server. It is built with Dioxus (Rust WASM framework) and communicates with the server's REST API.
Features
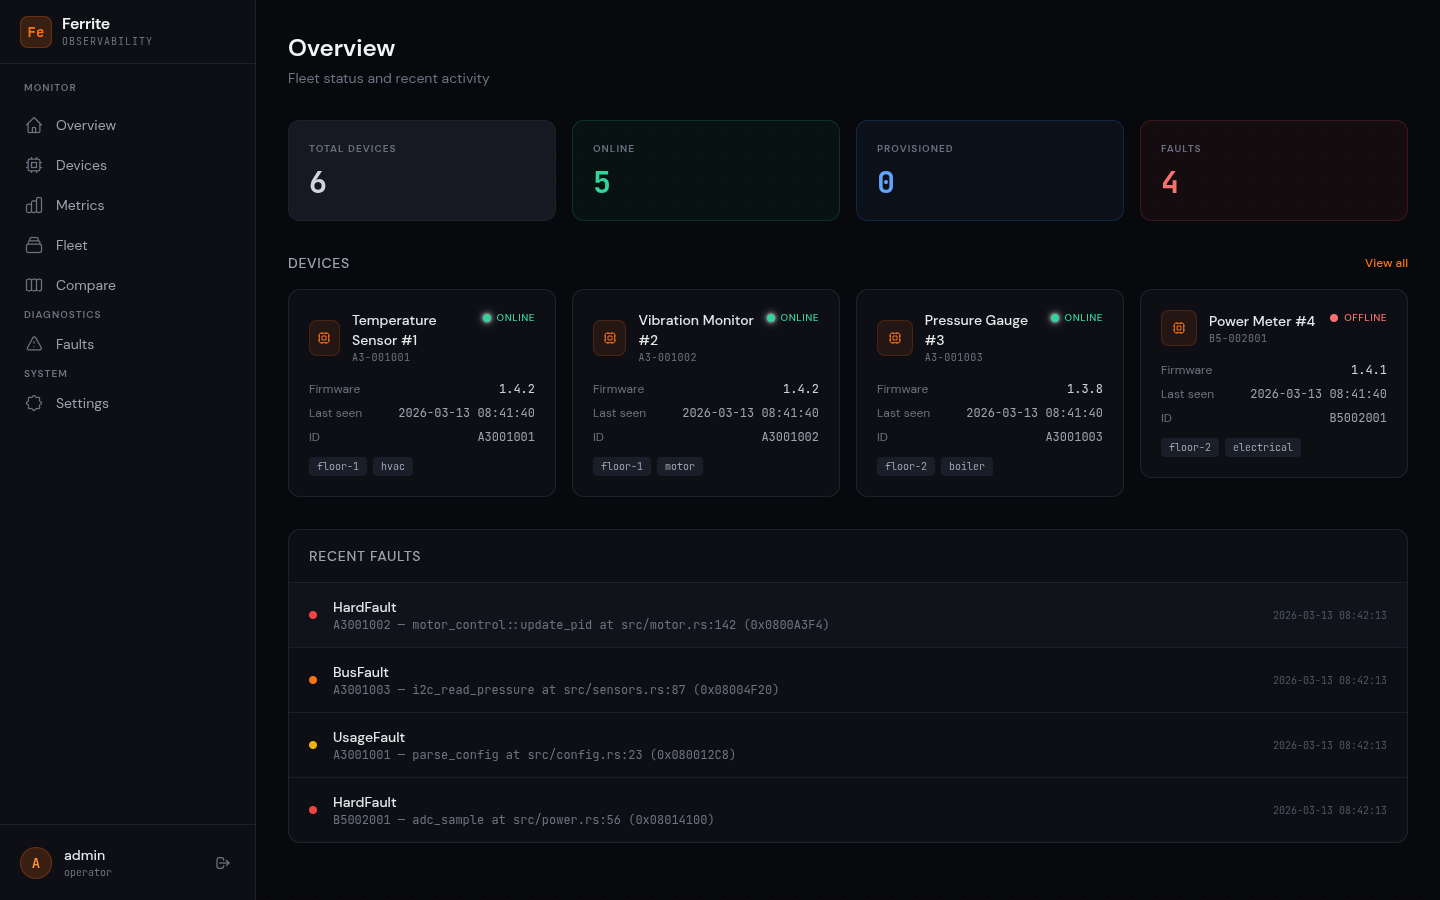
- Fleet overview — stat cards showing total devices, online count, and fault count
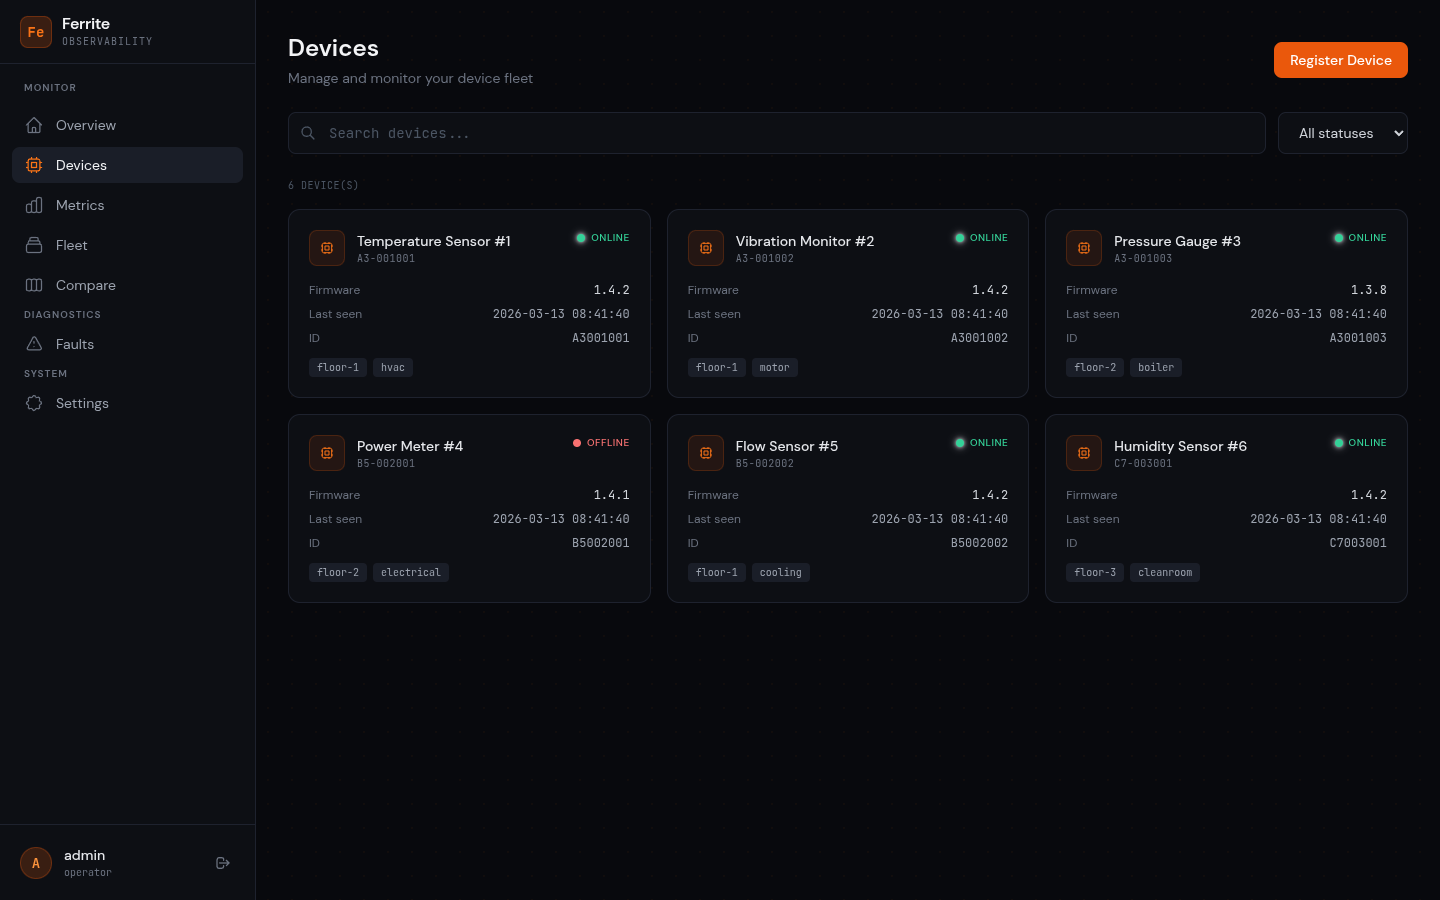
- Device management — search, filter by status, register new devices
- Fault diagnostics — browse crash dumps with symbolicated addresses and register values
- Metrics visualization — SVG time-series charts per metric key with latest values
- Fleet view — tag-based device grouping with health bar
- Device comparison — side-by-side metric charts for 2-3 devices
- CSV/JSON export — download fault and metric data for offline analysis
- Real-time updates — configurable polling interval (1s to 60s)
- Dual auth — Keycloak OIDC with PKCE or Basic auth, auto-detected at startup
Pages
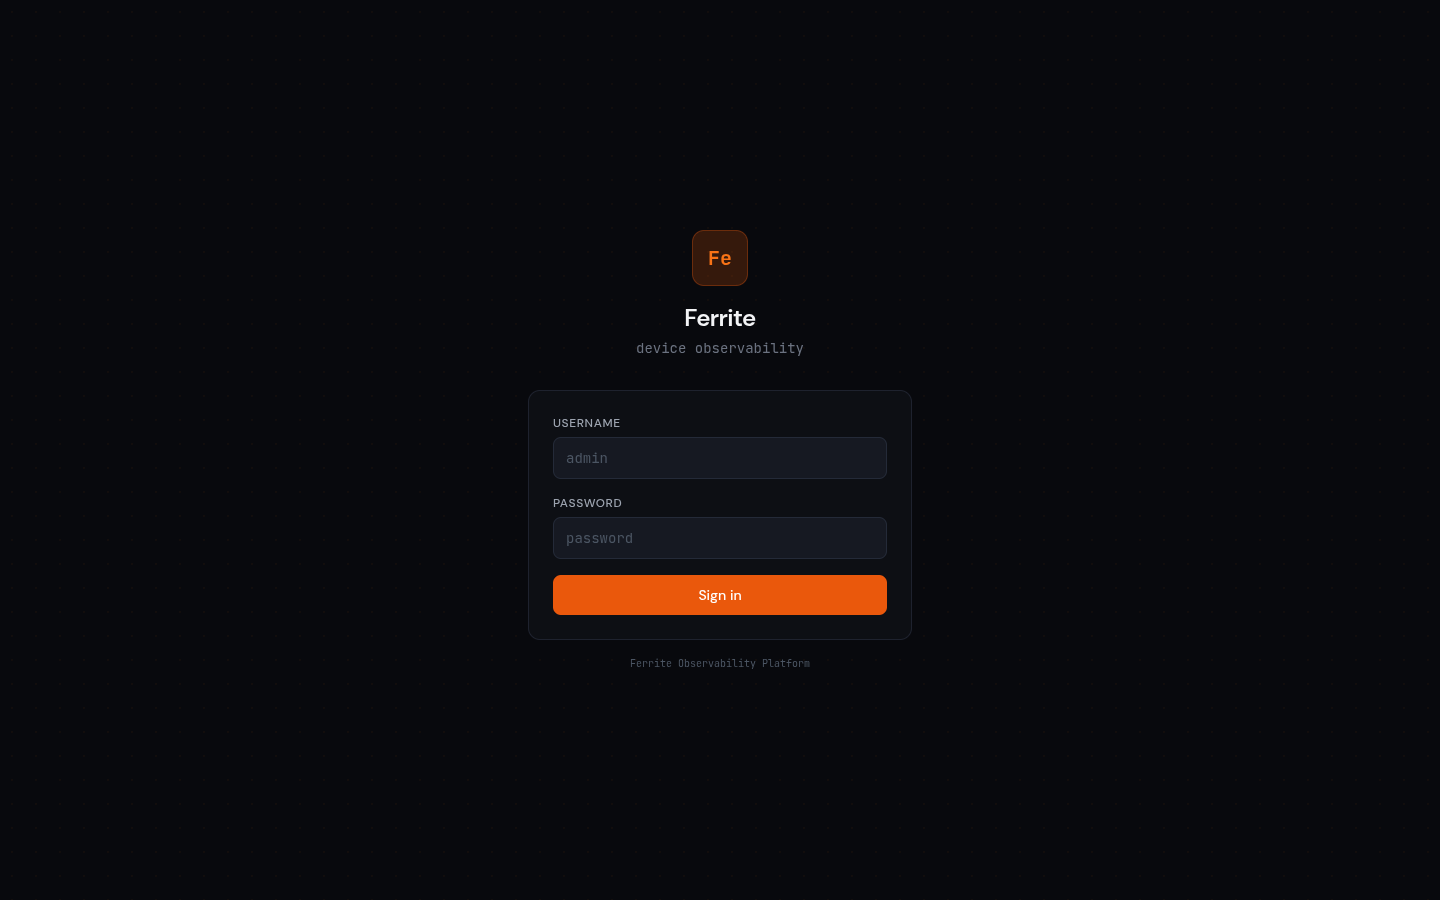
Login
Adapts to the server's auth mode. Keycloak mode shows an SSO button; Basic mode shows a username/password form.
Overview (Dashboard)
Fleet status at a glance: stat cards, recent devices, and recent faults with symbolicated crash info.
Devices
Search and filter the device fleet. Each device card shows name, firmware version, status, tags, and last-seen time.
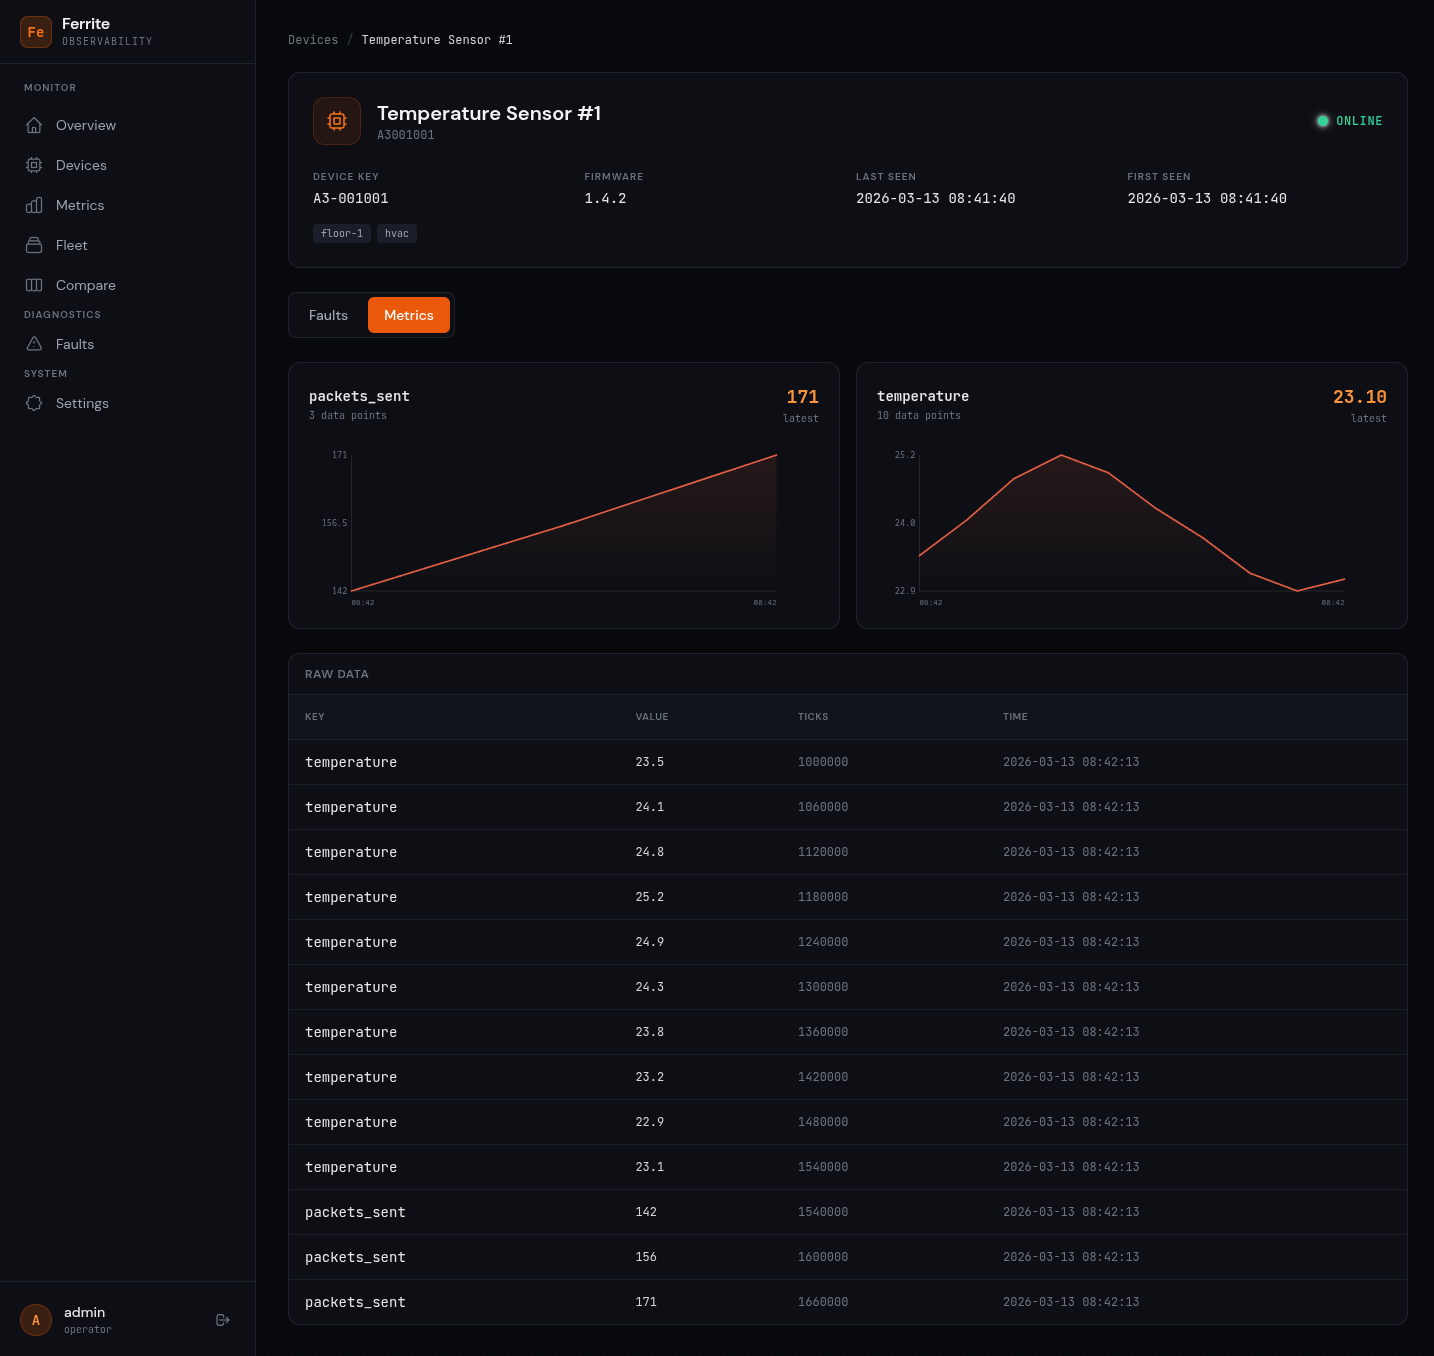
Device Detail
Deep dive into a single device. Tabs switch between Faults (crash dumps with PC/LR addresses and symbols) and Metrics (SVG charts per key + raw data table).
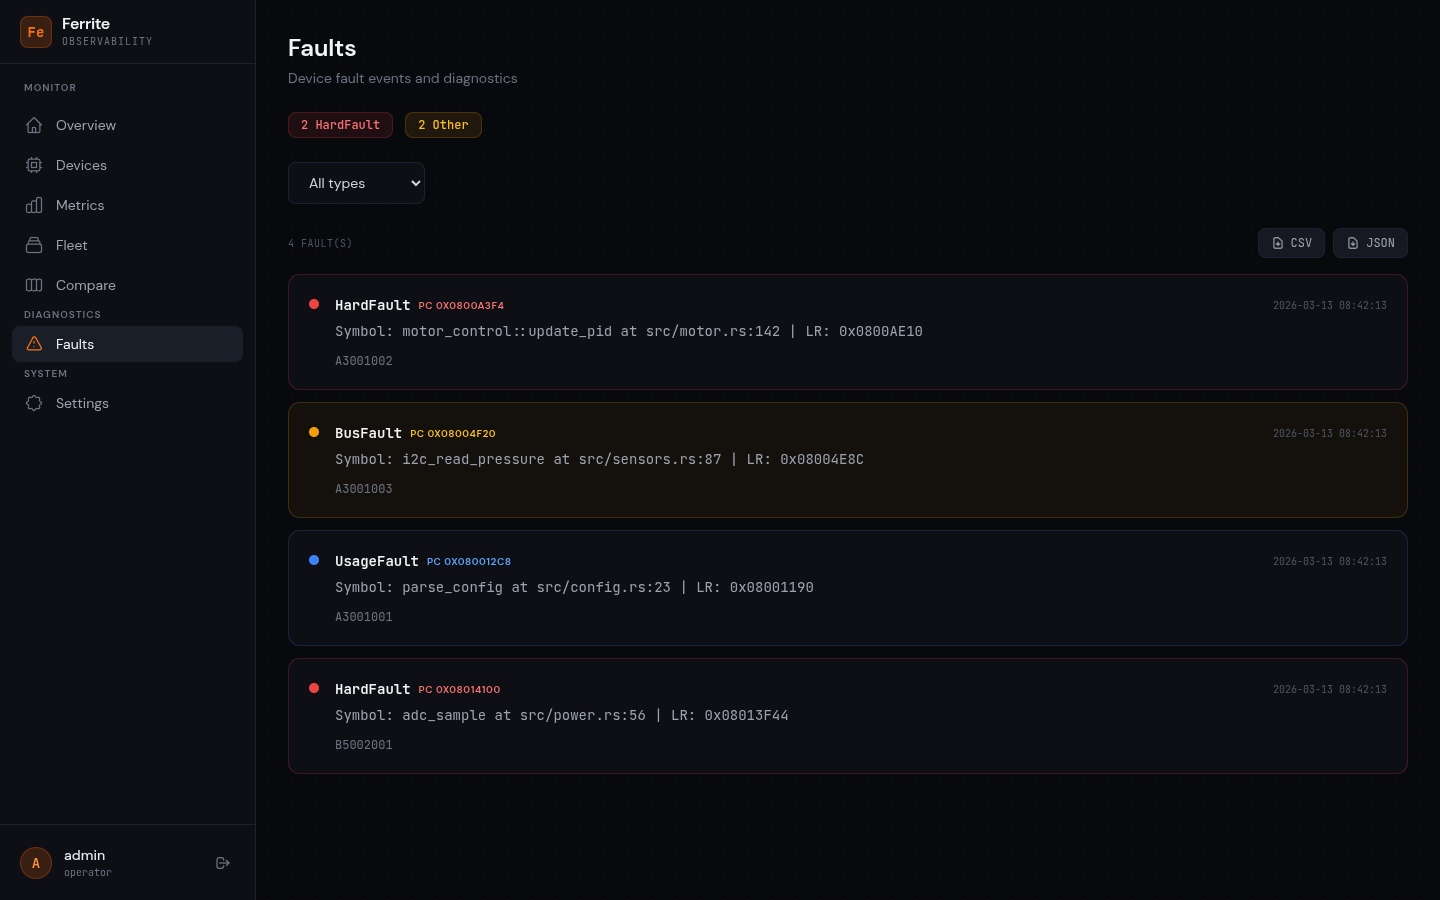
Faults
All fault events across the fleet. Color-coded by severity (red = HardFault, amber = BusFault, blue = UsageFault). Filter by type and export to CSV/JSON.
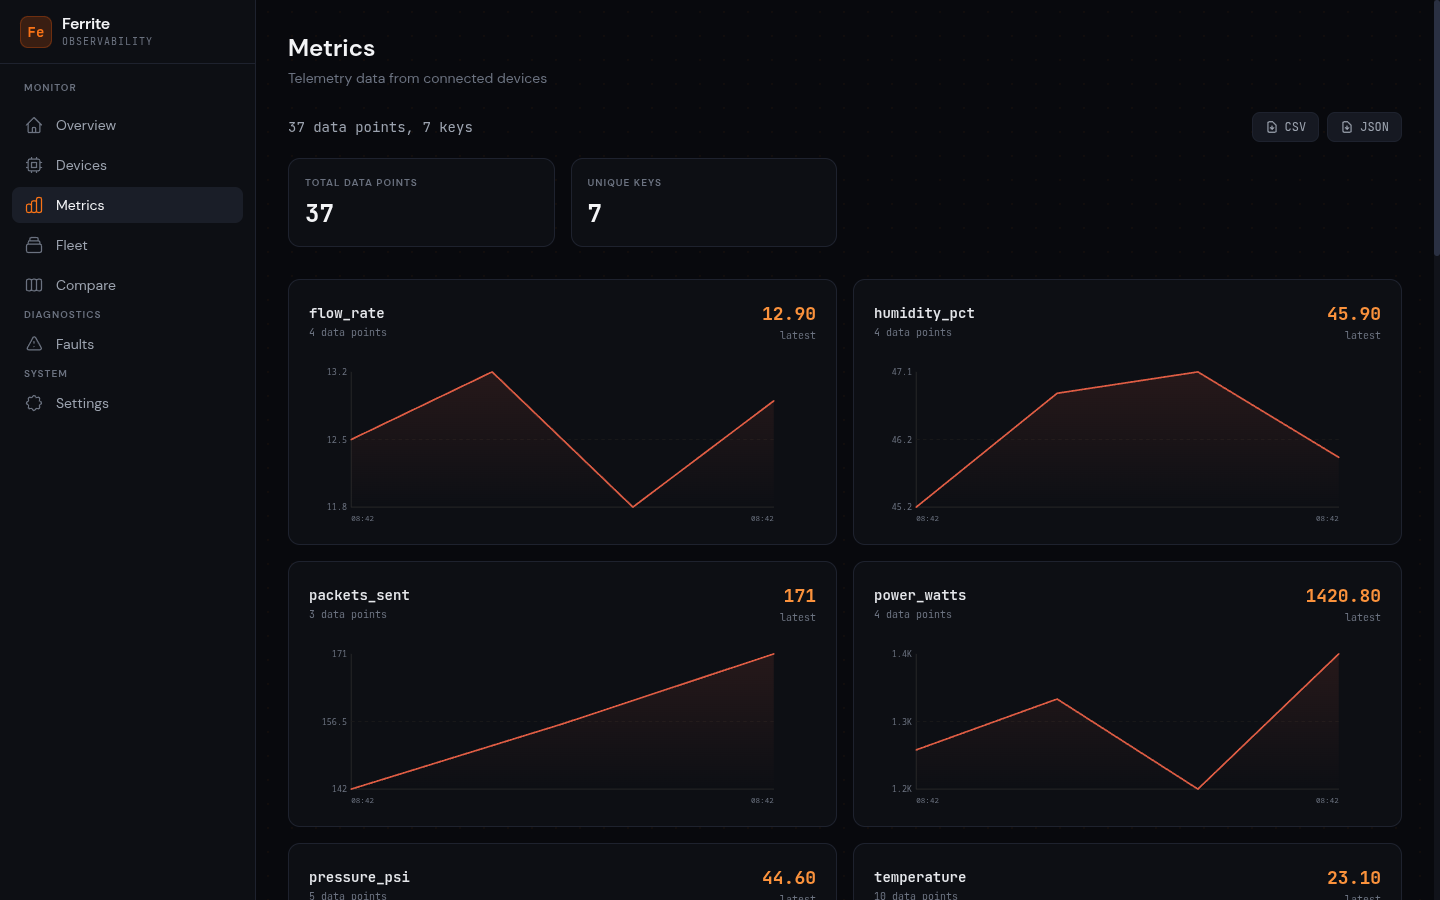
Metrics
Fleet-wide telemetry with one SVG chart per unique metric key. Shows total data points and unique key count. Export buttons for CSV and JSON.
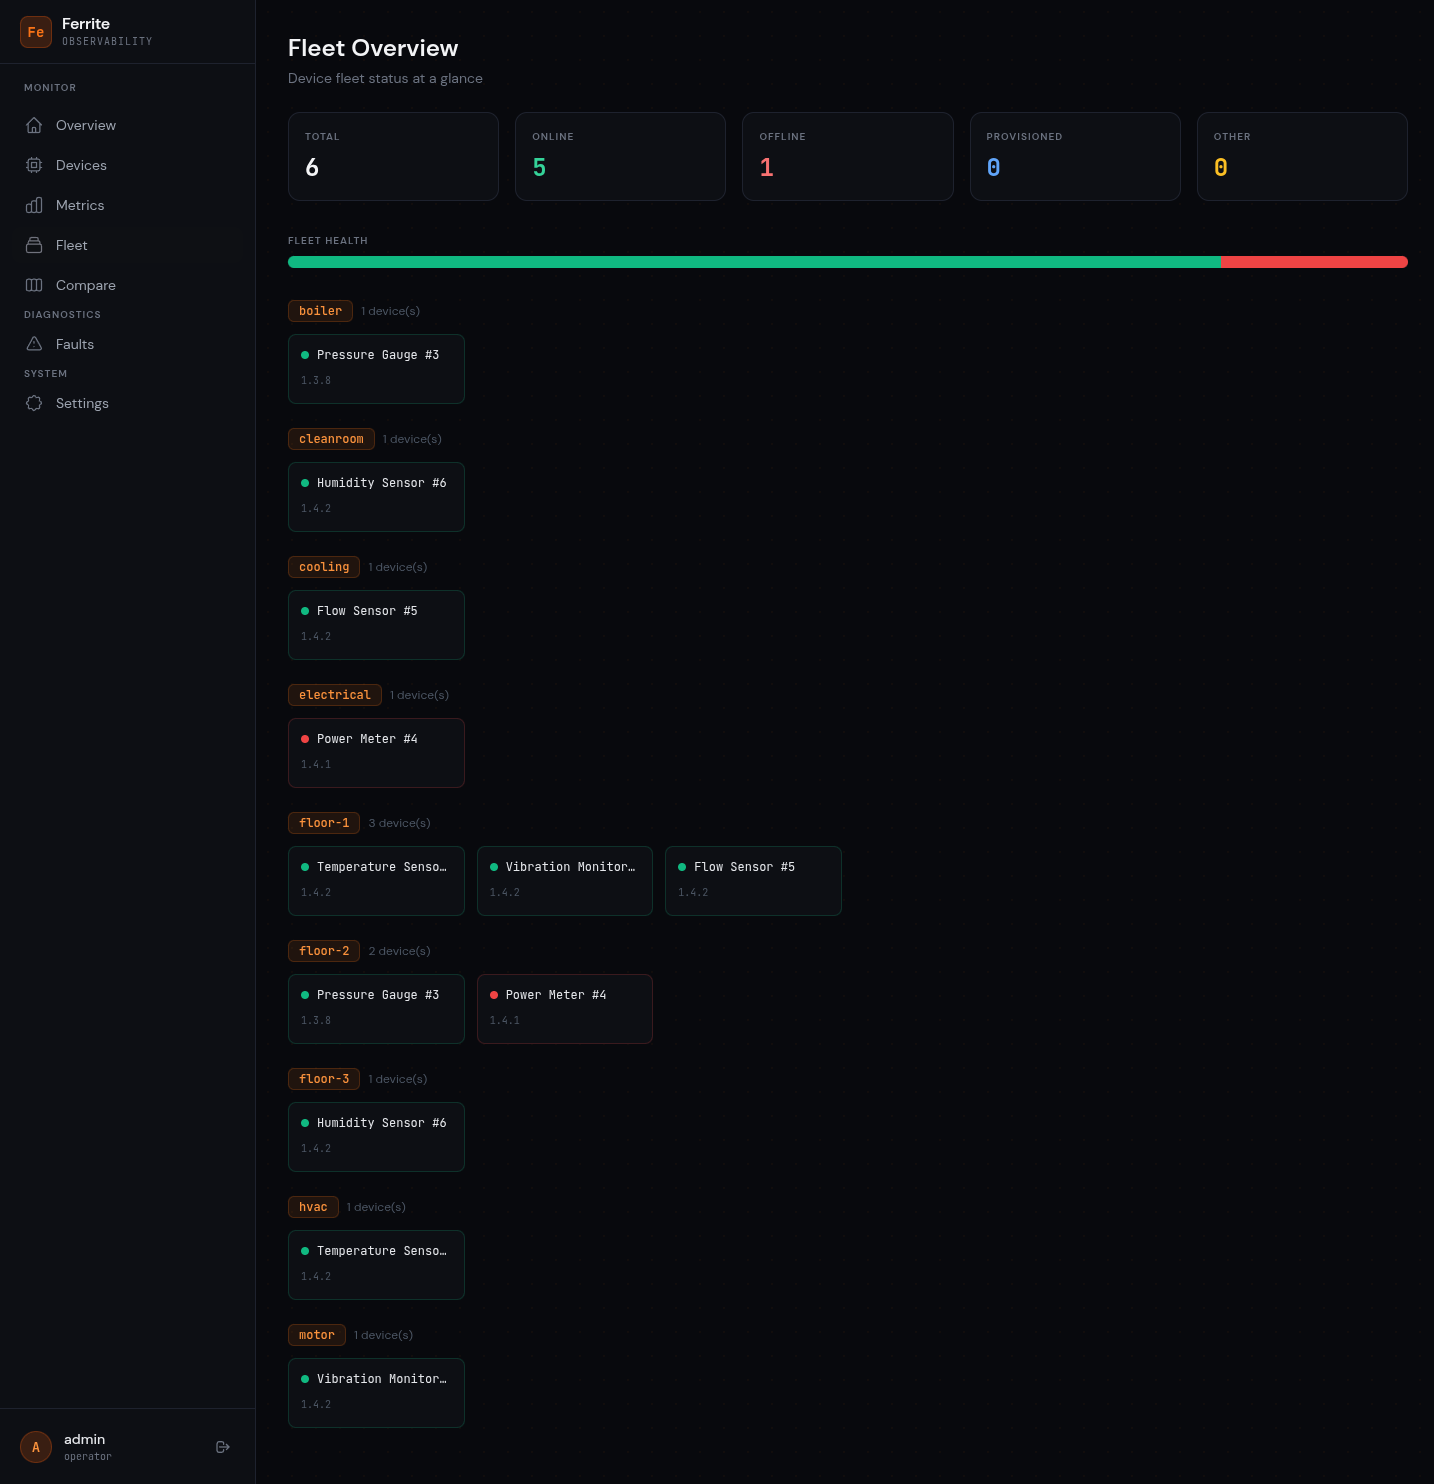
Fleet
High-level fleet view with status summary cards, a stacked health bar, and devices grouped by tags. Each tag section shows compact device tiles.
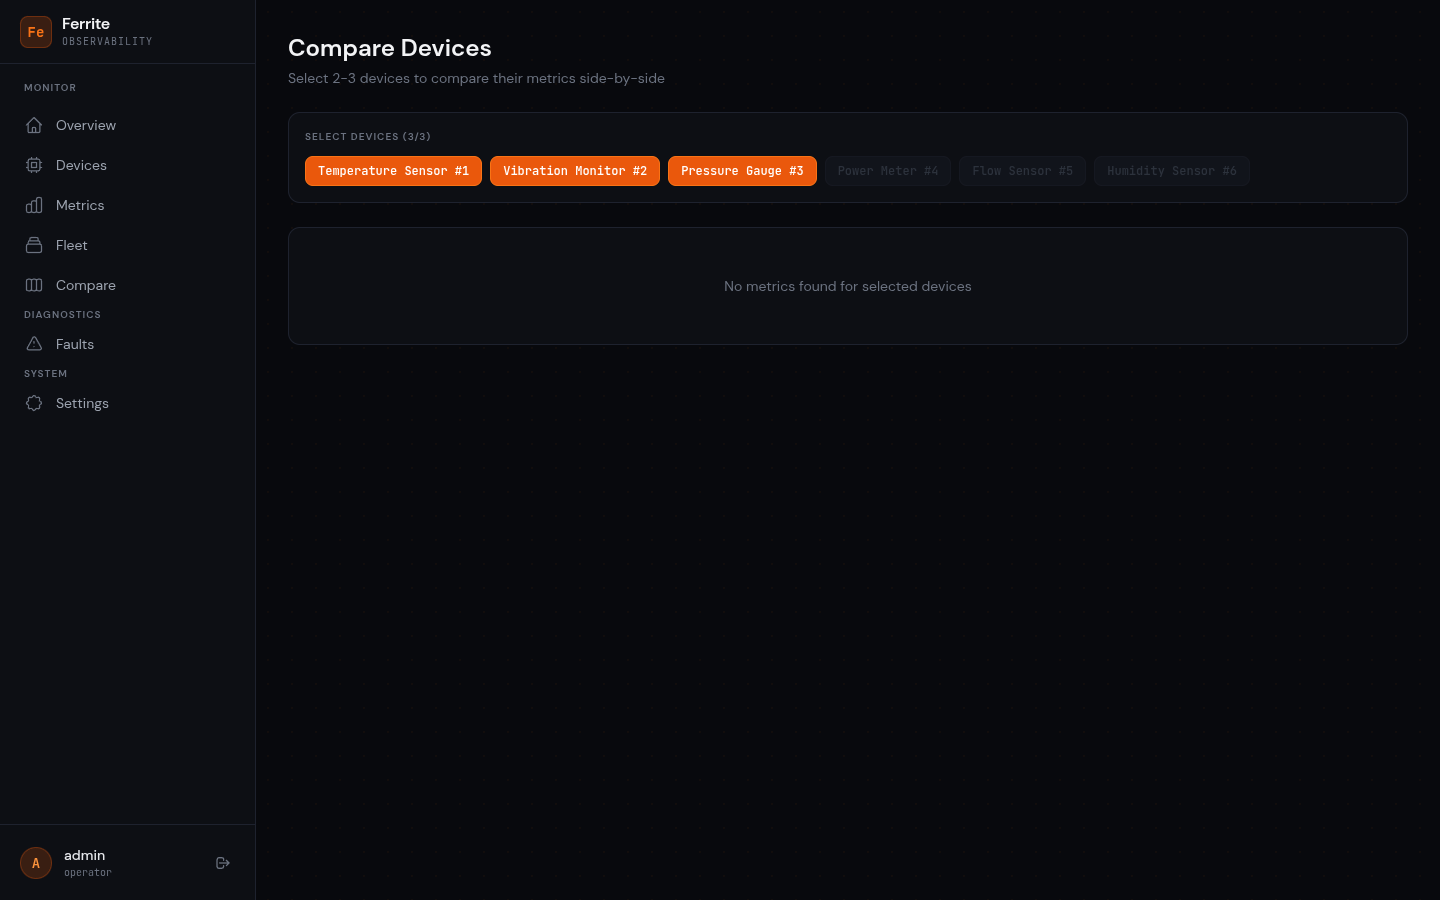
Compare
Select 2-3 devices to compare their metrics side-by-side. Charts are grouped by metric key with one chart per device.
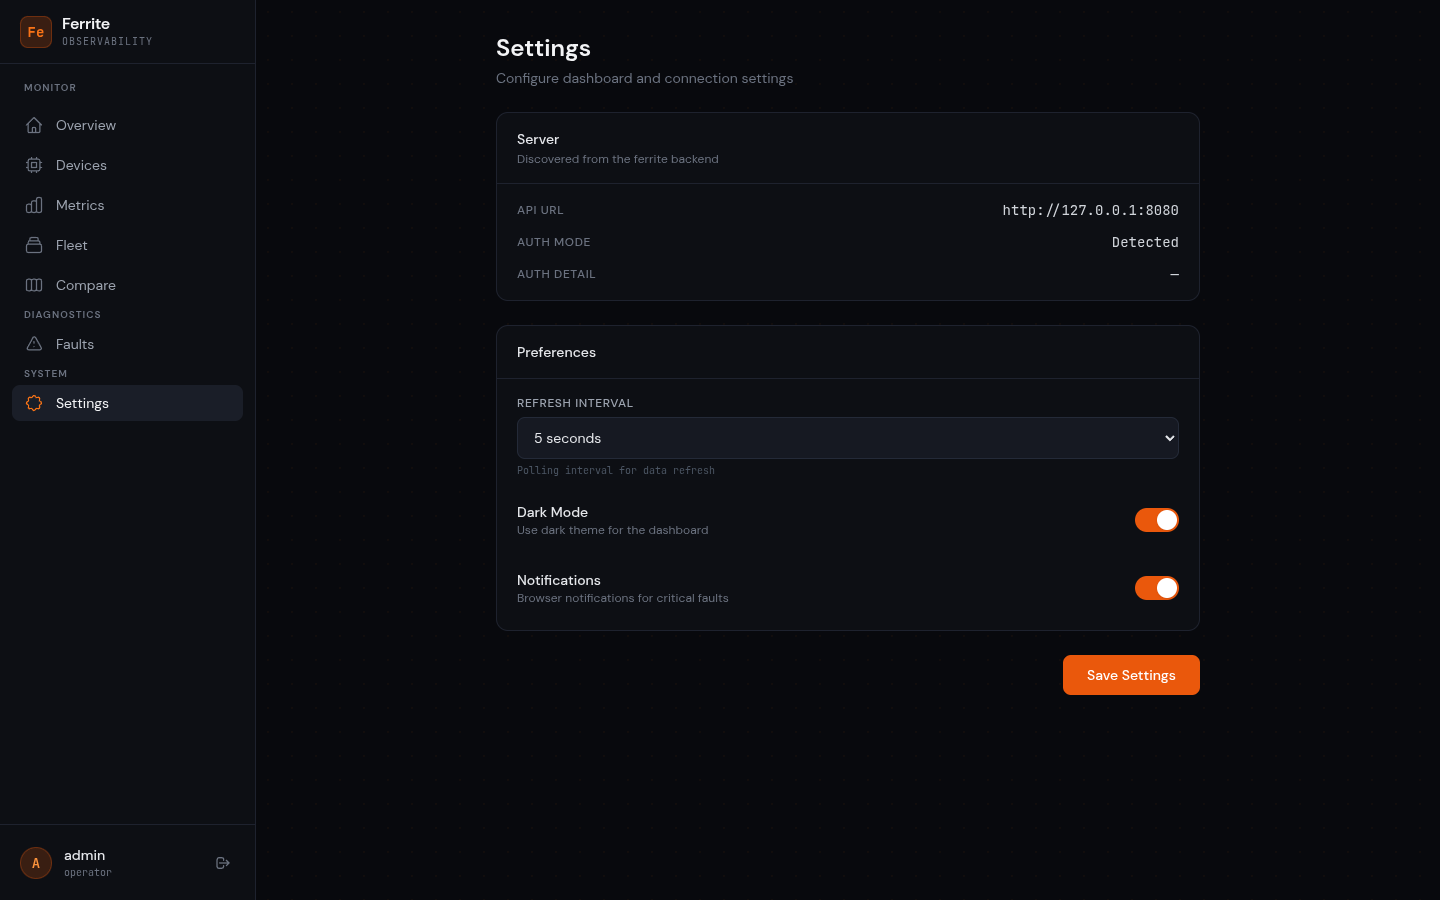
Settings
Configure dashboard preferences: polling interval, dark mode, and notifications. Shows detected server auth mode.
Running the dashboard
# Development (with hot reload, proxies API to localhost:4000)
cd ferrite-dashboard
dx serve

# Production build
cd ferrite-dashboard
dx build --release
The output directory can be served by any static file server. The dev server proxies /auth, /devices, /ingest, /health, /faults, /metrics, /groups, /events, /admin, and /ota to localhost:4000 (configured in Dioxus.toml).
Connecting to the server
By default, the dashboard connects to the same origin it's served from. In development, the dx serve proxy handles routing API calls to the ferrite-server on port 4000.
For production deployments, serve the dashboard and API from the same origin using a reverse proxy (nginx, Caddy), or configure CORS on the server with CORS_ORIGIN.